

Gold Silver Price Ratio
The gold silver ratio, simply put, is how many ounces of silver can be used to purchase an ounce of gold. For example, if the gold silver ratio is currently 70:1, one would be able to purchase 70 ounces of silver to an ounce of gold. It must be noted that, (obviously) the same unit of measurement must be used for both sides of the ratio, generally troy ounce (31.1035 grams) is used.
The live gold silver ratio is shown on this page but if there is ever a time you can only access our live prices
page then the ratio is simply the live gold price divided by the live silver price. For example, the live gold price (troy ounces) is 705. The silver price (troy ounces) is 9.35, therefore 705/9.35 = 75.4 � 75.4 troy ounces of silver can be purchased with one troy ounce of gold. The figure can be shown as 75.4:1 or 75.4.
Relevance
Some sources state that the gold silver ratio is no longer relevant in today�s markets. We believe it is a worthwhile measure, but would stress that it is difficult if not impossible to state what the ratio �should� be. The higher the ratio would indicate that silver is �cheap�. If the ratio is lower, some investors may turn to invest in gold, possibly exchanging their silver in the process.History
When the first coins were made over 2,500 years ago in ancient Greece, the ratio of gold to silver was generally between 10:1 and 13.5:1, depending on the relative proximity of gold or silver mines. In the 1930's and 1940's the ratio reached 90:1 or higher, and in 1991 it peaked at about 98:1, although we have seen one source which claims over 100:1 peak. Other sources state that the gold silver ratio is no longer relevant in today's markets. We believe it is a worthwhile measure, but would stress that it is difficult if not impossible to state what the ratio "should" be.Silver Our page about silver as an investment.
Spot Silver Prices Live spot silver prices in pounds sterling (GBP).
Live Spot Gold Silver Ratio
You can find the latest gold silver ratio on our new website.Notes
This market data is provided as a free service for indication or information only. We accept no liability for any errors. It is based on latest available middle spot prices per ounce in US dollars.Historic Minimum Maximum & Mean Gold Silver Ratios 1970 - 2007 Summary of annualised monthly statistics.
2006 Gold Silver Price Ratio Table
2007 Gold Silver Price Ratio Table
2008 Gold Silver Price Ratio Table
2009 Gold Silver Price Ratio Table
2010 Gold Silver Price Ratio Table
2011 Gold Silver Price Ratio Table Up to 27th May.
Silver Can be a Good Investment
Gold Silver Price Ratio & Value - Update May 2011 Silver too high or gold too low?
Highest Historical Silver Bullion Price & Lowest Recent Silver Price
The all-time high price for silver was hit on 18th January 1980 at $49.45 (�21.65) per troy ounce fuelled by Nelson Bunker Hunt's cornering of the market.Silver then hit a post Bunker Hunt low of $3.54750 or £1.83250 per ounce on 25th February 1991.
In late 2010, silver has broken through a 30 year high of $30 per ounce.
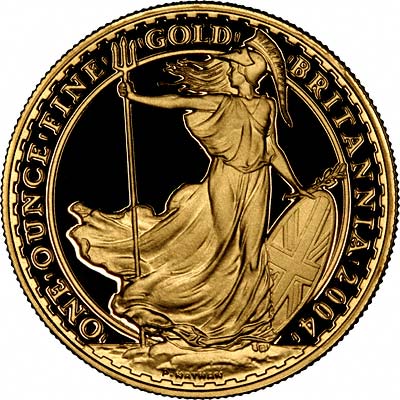
UK One Ounce Gold Britannia
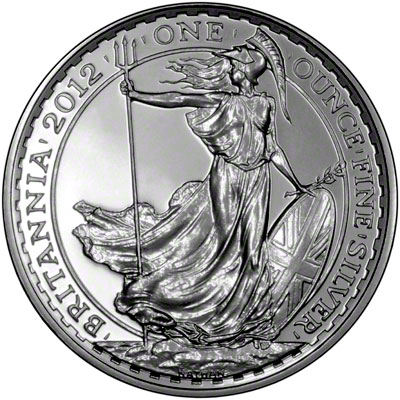
British One Ounce Silver Britannia
Other Gold Prices
You may prefer to use some of the other gold price pages on our site. These have a limited selection of prices, but using a larger display which makes them easier to read.- Sterling, US Dollars & Euros
- Pounds Sterling
- US Dollars
- Euros
- Canadian Dollars
- Hong Kong Dollars
- South African Rands
- Russian Roubles
- Indian Rupees
- Swiss Francs
- Japanese Yen
- Chinese Yuan (Renminbi)
- Gold Platinum Ratio
- Gold Silver Ratio
All Gold Prices Gold prices in 11 major currencies, but harder to read because of smaller font.
32 - 36 Harrowside, Blackpool, Lancashire, FY4 1RJ, England. Telephone (44) - (0) 1253 - 343081; Fax 408058;
E-mail: Contact Us The URL for our main page is: taxfreegold.co.uk