

Highest Ever Gold Price in Euros (EUR) €
The Greek economic & political crisis has hammered the euro, seeing euro gold price rise another 15% to break 962 on May 6th 2010.
The record high gold price in Euros has been broken many times. Notable high points include May 12th 2006 when the p.m. gold fix was €561.378, and January 3rd 2008 at €587.275. It has continued to break records, the most recent being 11th February at €635.908.
On Friday 12th May 2006, gold reached its record highest price ever in euros, the afternoon London Gold Fix was €561.378, although in US dollars it was still only $725.00.
Gold has only been fixed in Euros since 1st January 2000, before that date it is shown in two currencies only, the pound sterling and the US dollar.
Yet Again! Shortly after we finished updating this page on 20th February 2008, gold shot up yet again in late trading, by about €12 per ounce, and hitting new record highs in all three gold fixing currencies.
And Again! On 21st February 2008, gold broke all three currency price records yet again, at £482.759; $945.00; and €641.200 per ounce on the afternoon London Fix. Intraday trading was even higher at over $950, breaking another magic psychological barrier. Next stop $1,000?
Quick Summary Table
Entries in bold face signify a record high in that currency.
| Date | Fix | Price £ | Price $ | Price ? |
|---|---|---|---|---|
|
21st January 1980
|
P.M. | £371.066 | $850.00 | N/A |
|
23rd May 2001
|
A.M. | £199.683 | $283.85 | ?330.712 |
|
24th May 2001
|
P.M. | £202.442 | $286.05 | ?332.616 |
|
8th Feb 2002
|
A.M. | £216.107 | $305.10 | ?349.605 |
|
5th Feb 2003
|
A.M. | £233.009 | $385.00 | ?352.564 |
|
13th June 2005
|
A.M. | £236.051 | $425.60 | ?353.400 |
|
13th June 2005
|
P.M. | £238.124 | $429.10 | ?356.395 |
|
16th June 2005
|
A.M. | £237.004 | $431.50 | ?356.446 |
|
16th June 2005
|
P.M. | £237.716 | $433.00 | ?358.088 |
|
17th June 2005
|
A.M. | £239.154 | $436.05 | ?359.540 |
|
20th June 2005
|
A.M. | £241.040 | $440.50 | ?360.327 |
|
20th June 2005
|
P.M. | £241.070 | $439.35 | ?361.605 |
|
24th June 2005
|
P.M. | £241.450 | $439.15 | ?364.501 |
|
25th June 2005
|
A.M. | £243.513 | $442.95 | ?367.289 |
|
15th September 2005
|
P.M. | £251.897 | $454.80 | ?372.634 |
|
16th September 2005
|
A.M. | £252.884 | $458.10 | ?373.350 |
|
16th September 2005
|
P.M. | £253.577 | $457.20 | ?374.294 |
|
19th September 2005
|
A.M. | £243.513 | $442.95 | ?367.289 |
|
19th September 2005
|
P.M. | £256.354 | $461.95 | ?380.519 |
|
20th September 2005
|
A.M. | £260.503 | $470.00 | ?386.609 |
|
22nd September 2005
|
A.M. | £261.839 | $472.75 | ?386.866 |
|
27th September 2005
|
A.M. | £263.362 | $465.65 | ?387.074 |
|
29th September 2005
|
A.M. | £267.523 | $472.50 | ?391.596 |
|
29th September 2005
|
P.M. | £268.135 | $472.40 | ?392.914 |
|
30th September 2005
|
A.M. | £268.825 | $473.40 | ?393.516 |
|
10th October 2005
|
A.M. | £271.507 | $477.50 | ?393.814 |
|
11th October 2005
|
A.M. | £271.172 | $475.50 | ?394.934 |
|
11th October 2005
|
P.M. | £272.259 | $475.50 | ?396.250 |
|
12th October 2005
|
A.M. | £273.820 | $478.50 | ?398.983 |
|
14th November 2005
|
A.M. | £268.967 | $469.75 | ?399.957 |
|
15th November 2005
|
A.M. | £269.792 | $467.55 | ?400.128 |
|
15th November 2005
|
P.M. | £270.274 | $467.55 | ?401.414 |
|
16th November 2005
|
A.M. | £272.178 | $470.65 | ?402.334 |
|
16th November 2005
|
P.M. | £277.163 | $475.75 | ?408.194 |
|
17th November 2005
|
A.M. | £279.750 | $480.75 | ?411.672 |
|
17th November 2005
|
P.M. | £282.645 | $486.15 | ?414.804 |
|
18th November 2005
|
A.M. | £284.855 | $487.90 | ?417.615 |
|
22nd November 2005
|
A.M. | £287.883 | $493.00 | ?421.116 |
|
25nd November 2005
|
A.M. | £288.365 | $495.70 | ?421.624 |
|
25nd November 2005
|
P.M. | £288.347 | $493.00 | ?422.078 |
|
28nd November 2005
|
A.M. | £290.853 | $497.30 | ?424.789 |
|
1st December 2005
|
P.M. | £289.124 | $499.75 | ?426.663 |
|
2nd December 2005
|
A.M. | £292.033 | $504.75 | ?431.042 |
|
5th December 2005
|
A.M. | £291.773 | $505.00 | ?431.513 |
|
6th December 2005
|
A.M. | £293.311 | $508.25 | ?432.002 |
|
7th December 2005
|
A.M. | £295.751 | $512.30 | ?436.818 |
|
7th December 2005
|
P.M. | £297.661 | $508.25 | ?439.761 |
|
9th December 2005
|
A.M. | £299.857 | $524.75 | ?445.081 |
|
12th December 2005
|
A.M. | £304.636 | $537.50 | ?452.213 |
|
13th January 2006
|
A.M. | £309.688 | $547.25 | ?453.510 |
|
13th January 2006
|
P.M. | £309.781 | $548.25 | ?454.489 |
|
14th January 2006
|
A.M. | £315.867 | $559.40 | ?460.601 |
|
14th January 2006
|
P.M. | £318.200 | $561.75 | ?463.758 |
|
30th January 2006
|
P.M. | £319.353 | $565.00 | ?467.174 |
|
31st January 2006
|
A.M. | £321.231 | $569.80 | ?470.792 |
|
2nd February 2006
|
A.M. | £322.078 | $571.85 | ?473.699 |
|
2nd February 2006
|
P.M. | £322.247 | $572.15 | ?474.144 |
|
3rd February 2006
|
P.M. | £322.562 | $569.00 | ?474.167 |
|
6th February 2006
|
A.M. | £324.694 | $570.00 | ?475.000 |
|
6th February 2006
|
P.M. | £325.571 | $569.75 | ?475.982 |
|
30th March 2006
|
A.M. | £332.624 | $578.50 | ?479.089 |
|
30th March 2006
|
P.M. | £335.883 | $584.00 | ?483.604 |
|
3rd April 2006
|
A.M. | £339.204 | $585.50 | ?485.892 |
|
3rd April 2006
|
P.M. | £339.463 | $587.00 | ?486.048 |
|
7th April 2006
|
A.M. | £341.026 | $597.00 | ?489.545 |
|
10th April 2006
|
A.M. | £342.309 | $597.50 | ?492.987 |
|
11th April 2006
|
A.M. | £343.849 | $599.50 | ?494.433 |
|
18th April 2006
|
A.M. | £348.053 | $616.75 | ?503.059 |
|
19th April 2006
|
A.M. | £348.990 | $623.75 | ?504.530 |
|
19th April 2006
|
P.M. | £349.513 | $624.75 | ?506.157 |
|
20th April 2006
|
A.M. | £361.469 | $644.50 | ?521.862 |
|
2nd May 2006
|
P.M. | £360.061 | $661.00 | ?523.481 |
|
3rd May 2006
|
A.M. | £367.263 | $675.25 | ?534.344 |
|
5th May 2006
|
A.M. | £368.888 | $682.00 | ?537.770 |
|
9th May 2006
|
P.M. | £370.663 | $691.25 | ?542.114 |
|
10th May 2006
|
A.M. | £378.249 | $704.30 | ?551.052 |
|
11th May 2006
|
A.M. | £379.149 | $707.00 | ?555.687 |
|
11th May 2006
|
P.M. | £382.109 | $715.50 | ?559.728 |
|
12th May 2006
|
A.M. | £382.739 | $725.75 | ?561.378 |
|
12th May 2006
|
P.M. | £382.424 | $725.00 | ?561.711 |
|
6th November 2007
|
A.M. | £392.129 | $817.56 | ?562.973 |
|
6th November 2007
|
P.M. | £393.767 | $822.50 | ?564.710 |
|
7th November 2007
|
A.M. | £400.471 | $841.75 | ?573.555 |
|
2nd January 2008
|
P.M. | £427.824 | $846.75 | ?576.452 |
|
3rd January 2008
|
A.M. | £438.485 | $865.75 | ?587.275 |
|
8th January 2008
|
A.M. | £441.571 | $873.25 | ?593.805 |
|
9th January 2008
|
A.M. | £452.154 | $887.85 | ?603.528 |
|
11th January 2008
|
A.M. | £457.559 | $893.75 | ?604.743 |
|
14th January 2008
|
P.M. | £460.674 | $902.00 | ?606.387 |
|
15th January 2008
|
P.M. | £463.358 | $913.00 | ?612.834 |
|
24th January 2008
|
P.M. | £461.947 | $909.25 | ?617.949 |
|
25th January 2008
|
P.M. | £462.921 | $918.25 | ?623.981 |
|
28th January 2008
|
P.M. | £464.217 | $921.75 | ?623.985 |
|
29th January 2008
|
P.M. | £465.157 | $924.50 | ?625.973 |
|
8th February 2008
|
A.M. | £468.958 | $914.00 | ?631.172 |
|
8th February 2008
|
P.M. | £471.104 | $916.25 | ?632.682 |
|
11th February 2008
|
A.M. | £474.372 | $925.50 | ?635.908 |
|
21st February 2008
|
A.M. | £482.032 | $943.00 | ?639.756 |
|
21st February 2008
|
P.M. | £482.759 | $945.00 | ?641.200 |
|
3rd March 2008
|
A.M. | £492.697 | $978.25 | ?644.943 |
|
3rd March 2008
|
P.M. | £496.684 | $988.50 | ?647.857 |
|
17th March 2008
|
A.M. | £508.511 | $1,023.50 | ?649.511 |
|
7th October 2008
|
A.M. | £507.190 | $881.75 | ?651.219 |
|
8th October 2008
|
A.M. | £523.209 | $913.00 | ?669.748 |
|
10th October 2008
|
A.M. | £542.810 | $918.00 | ?675.845 |
|
23rd January 2009
|
A.M. | £644.233 | $873.00 | ?681.339 |
|
23rd January 2009
|
A.M. | £644.233 | $873.00 | ?682.420 |
|
26th January 2009
|
A.M. | £656.646 | $906.50 | ?699.676 |
|
30th January 2009
|
A.M. | £641.635 | $918.50 | ?713.398 |
|
30th January 2009
|
P.M. | £642.288 | $919.50 | ?715.620 |
|
2nd February 2009
|
A.M. | £642.581 | $911.75 | ?717.736 |
|
2nd February 2009
|
P.M. | £649.123 | $918.25 | ?717.831 |
|
11th February 2009
|
P.M. | £653.795 | $938.00 | ?727.583 |
|
12th February 2009
|
A.M. | £666.337 | $944.00 | ?737.039 |
|
12th February 2009
|
P.M. | £663.746 | $943.25 | ?740.094 |
|
17th February 2009
|
A.M. | £674.932 | $962.25 | ?761.515 |
|
17th February 2009
|
P.M. | £678.584 | $968.00 | ?766.976 |
|
18th February 2009
|
A.M. | £680.648 | $964.75 | ?767.014 |
|
18th February 2009
|
P.M. | £679.447 | $964.00 | ?767.944 |
|
19th February 2009
|
A.M. | £677.925 | $973.50 | ?768.169 |
|
19th February 2009
|
P.M. | £684.133 | $980.50 | ?771.561 |
|
20th February 2009
|
A.M. | £687.201 | $981.00 | ?778.201 |
|
20th February 2009
|
P.M. | £690.353 | $989.00 | ?782.437 |
|
24th November 2009
|
A.M. | £708.813 | $1170.25 | ?782.933 |
|
25th November 2009
|
P.M. | £706.733 | $1179.75 | ?783.107 |
|
26th November 2009
|
A.M. | £714.223 | $1183.00 | ?784.223 |
|
26th November 2009
|
P.M. | £716.297 | $1182.75 | ?787.240 |
|
2nd December 2009
|
A.M. | £727.104 | $1211.50 | ?802.105 |
|
2nd December 2009
|
P.M. | £727.922 | $1212.50 | ?804.312 |
|
3rd December 2009
|
P.M. | £728.382 | $1208.75 | ?805.455 |
|
15th February 2010
|
A.M. | £701.212 | $1099.50 | ?807.290 |
|
15th February 2010
|
P.M. | £701.309 | $1098.25 | ?808.072 |
|
16th February 2010
|
A.M. | £710.577 | $1115.25 | ?816.315 |
|
16th February 2010
|
P.M. | £713.075 | $1115.25 | ?816.674 |
|
17th February 2010
|
P.M. | £709.845 | $1119.00 | ?817.027 |
|
18th February 2010
|
P.M. | £714.240 | $1118.00 | ?820.129 |
|
19th February 2010
|
P.M. | £721.815 | $1112.75 | ?824.198 |
|
2nd March 2010
|
A.M. | £747.438 | $1116.00 | ?826.973 |
|
2nd March 2010
|
P.M. | £752.857 | $1126.50 | ?831.243 |
|
3rd March 2010
|
A.M. | £755.536 | $1136.25 | ?834.067 |
|
5th March 2010
|
A.M. | £755.006 | $1135.00 | ?834.989 |
|
5th March 2010
|
P.M. | £755.307 | $1135.00 | ?836.527 |
|
6th April 2010
|
A.M. | £741.620 | $1124.00 | ?837.743 |
|
6th April 2010
|
P.M. | £746.704 | $1132.75 | ?847.133 |
|
7th April 2010
|
P.M. | £751.217 | $1142.00 | ?854.726 |
|
8th April 2010
|
A.M. | £754.972 | $1146.50 | ?862.744 |
|
9th April 2010
|
A.M. | £752.898 | $1156.00 | ?863.009 |
|
26th April 2010
|
A.M. | £747.409 | $1154.00 | ?867.800 |
|
28th April 2010
|
A.M. | £767.924 | $1164.25 | ?884.285 |
|
30th April 2010
|
P.M. | £773.076 | $1179.25 | ?887.388 |
|
4th May 2010
|
A.M. | £779.00 | $1184.25 | ?901.462 |
|
4th May 2010
|
P.M. | £782.798 | $1185. | ?907.281 |
|
6th May 2010
|
A.M. | £783.088 | $1178.00 | ?922.764 |
|
6th May 2010
|
P.M. | £787.385 | $1185.25 | ?928.807 |
|
7th May 2010
|
A.M. | £825.602 | $1199.60 | ?941.823 |
|
7th May 2010
|
P.M. | £818.581 | $1202.25 | ?949.045 |
|
11th May 2010
|
A.M. | £815.074 | $1209.00 | ?953.771 |
|
11th May 2010
|
P.M. | £824.065 | $1222.50 | ?960.405 |
|
12th May 2010
|
A.M. | £831.825 | $1241.25 | ?977.901 |
|
13th May 2010
|
A.M. | £836.664 | $1235.00 | ?982.811 |
|
13th May 2010
|
P.M. | £841.150 | $1237.50 | ?985.270 |
|
14th May 2010
|
A.M. | £852.664 | $1238.75 | ?993.304 |
|
14th May 2010
|
P.M. | £848.662 | $1236.50 | ?993.971 |
|
17th May 2010
|
A.M. | £852.682 | $1230.25 | ?999.553 |
|
1st Jun 2010
|
A.M. | £843.359 | $1219.75 | ?1006.390 |
|
1st Jun 2010
|
P.M. | £837.769 | $1227.75 | ?1003.470 |
|
7th Jun 2010
|
A.M. | £840.019 | $1212.40 | ?1012.190 |
|
7th Jun 2010
|
P.M. | £836.892 | $1215.00 | ?1017.500 |
|
8th Jun 2010
|
A.M. | £867.450 | $1248.00 | ?1048.030 |
|
30th Nov 2010
|
A.M. | £885.098 | $1375.00 | ?1056.070 |
|
30th Nov 2010
|
P.M. | £890.856 | $1383.50 | ?1063.820 |
|
6th Dec 2010
|
P.M. | £903.101 | $1415.25 | ?1065.860 |
|
28th Dec 2010
|
A.M. | £912.43 | $1403.50 | ?1069.900 |
|
28th Dec 2010
|
P.M. | £914.535 | $1412.50 | ?1075.370 |
|
23rd May 2011
|
A.M. | £935.562 | $1508.50 | ?1077.810 |
|
24th May 2011
|
A.M. | £942.224 | $1520.75 | ?1078.850 |
|
24th May 2011
|
P.M. | £944.867 | $1527.00 | ?1082.670 |
|
25th May 2011
|
A.M. | £947.884 | $1527.00 | ?1084.130 |
|
25th May 2011
|
P.M. | £939.809 | $1526.25 | ?1086.840 |
|
11th July 2011
|
A.M. | £966.318 | $1543.50 | ?1092.120 |
|
11th July 2011
|
P.M. | £976.705 | $1555.50 | ?1106.880 |
|
12th July 2011
|
P.M. | £977.001 | $1555.50 | ?1107.340 |
|
13th July 2011
|
A.M. | £984.711 | $1571.50 | ?1114.620 |
|
13th July 2011
|
P.M. | £988.358 | $1579.00 | ?1121.050 |
|
18th July 2011
|
A.M. | £992.825 | $1598.25 | ?1136.330 |
|
18th July 2011
|
P.M. | £994.279 | $1599.00 | ?1136.700 |
|
1st August 2011
|
P.M. | £996.378 | $1623.00 | ?1137.190 |
|
2nd August 2011
|
A.M. | £997.298 | $1624.00 | ?1145.280 |
|
2nd August 2011
|
P.M. | £1005.800 | $1637.75 | ?1147.370 |
|
3rd August 2011
|
A.M. | £1016.770 | $1667.50 | ?1163.400 |
|
3rd August 2011
|
P.M. | £1019.020 | $1669.25 | ?1166.570 |
|
4th August 2011
|
A.M. | £1018.200 | $1664.25 | ?1170.610 |
|
4th August 2011
|
P.M. | £1028.280 | $1679.50 | ?1186.170 |
|
8th August 2011
|
A.M. | £1040.944 | $1709.75 | ?1195.211 |
|
9th August 2011
|
A.M. | £1080.982 | $1770.00 | ?1241.757 |
|
10th August 2011
|
P.M. | £1094.706 | $1772.00 | ?1246.921 |
|
11th August 2011
|
A.M. | £1105.745 | $1786.00 | ?1254.390 |
|
18th August 2011
|
P.M. | £1109.759 | $1824.00 | ?1276.149 |
|
19th August 2011
|
A.M. | £1126.914 | $1862.00 | ?1299.281 |
|
22nd August 2011
|
A.M. | £1139.550 | $1877.75 | ?1303.179 |
|
23rd August 2011
|
P.M. | £1136.419 | $1876.00 | ?1303.955 |
|
2nd September 2011
|
P.M. | £1157.562 | $1854.00 | ?1318.927 |
|
5th September 2011
|
A.M. | £1174.667 | $1896.50 | ?1341.136 |
|
5th September 2011
|
P.M. | £1178.922 | $1895.00 | ?1345.594 |
Error Check
On 11th May 2010, we noticed that the a.m. fixes in euros on 2nd and 3rd December 2009 were shown as being identical at 802.105.
While this could be a coincidence, we believe it is more likely to be an error, and have asked the LBMA to check this. We will publish the outcome here as soon as we hear from them.
Record High in Beijing
The record price in Chinese Yuan was achieved on Tuesday 4th April 2006, according to the Beijing Daily newspaper, hitting 170 yuan per gram (21.25 dollars).
"Gold has never been sold at such a high price in Beijing," said Wang Jian, general manager of the Gongmei Mansion Gold Store, told the paper. "I doubt whether consumers will hesitate to buy gold ornaments now," he said.
Gold dealers in China's capital reacted cautiously in raising prices, fearing a drop in sales despite the fact that prices in southern China had surged to 178 yuan (22.25 dollars) per gram.
China is the world's third-biggest market for gold after India and the United States, according to the World Gold Council, an industry organization. Last year Chinese demand for gold rose 8 percent to more than 250 tons
Record High Gold Price in US Dollars
The previous all-time record high gold price in US dollars was reached on 21st January 1980, fixing at $850.00 on that day's p.m. fix.
This morning (12th May 2006), gold fixed at $725.75, a 25 year record, but still 15% below the highest recorded dollar price. Many now believe that it is only a matter of time before gold hits its all time high in US dollars also, perhaps on its way to $1,000+. Who knows? We certainly would not want to bet against it!
Highest Ever Gold Price in Pounds Sterling
Where Next?
Where does it go from here?
Gazing into our crystal ball, we would be surprised if it did not go on to break the all-time high in US dollars before too long.
Highest Gold Prices Summary in 3 Currencies Simplified table with only the latest peak prices shown.
2010 LBMA Gold Price Forecasts In U.S. Dollars
Bull Market? Does the drop after this price peak mean an end to the gold bull market, we believe not, more of a correction.
Highest Historical Silver Bullion Price & Lowest Recent Silver Price
The all-time high price for silver was hit on 18th January 1980 at $49.45 (£21.65) per troy ounce fuelled by Nelson Bunker Hunt's cornering of the market.Silver then hit a post Bunker Hunt low of $3.54750 or £1.83250 per ounce on 25th February 1991.
In late 2010, silver has broken through a 30 year high of $30 per ounce.
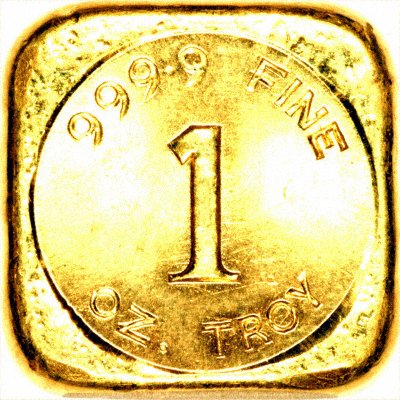
One Ounce Gold Bar
32 - 36 Harrowside, Blackpool, Lancashire, FY4 1RJ, England. Telephone (44) - (0) 1253 - 343081; Fax 408058;
E-mail: Contact Us The URL for our main page is: taxfreegold.co.uk