Gold Price Chart
In US Dollars per Troy Ounce
In US Dollars per Troy Ounce
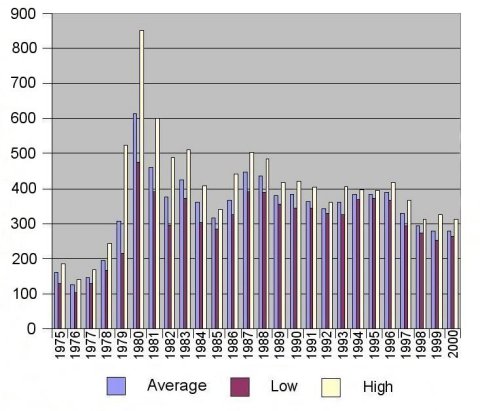
We are always being asked for gold price charts. In an attempt to provide helpful and useful information, we have prepared the table below and corresponding graph opposite. These show highest, lowest and average monthly London gold bullion fix prices from 1975 to 2000. All prices shown are in US Dollars per ounce troy. We are sorry we do not have a similar chart currently available in pounds sterling or any other currency.
A daily gold price chart is available on the website of the London Bullion Market Association
.
The London Gold Fixing Explained
Live Gold Prices
We now provide live gold prices, please see our Live Gold Prices
page.
London Fix in US Dollars

"Tax Free Gold" website is owned and operated by Chard (1964) Limited
32 - 36 Harrowside, Blackpool, Lancashire, FY4 1RJ, England. Telephone (44) - (0) 1253 - 343081; Fax 408058;
E-mail: Contact Us The URL for our main page is: taxfreegold.co.uk
32 - 36 Harrowside, Blackpool, Lancashire, FY4 1RJ, England. Telephone (44) - (0) 1253 - 343081; Fax 408058;
E-mail: Contact Us The URL for our main page is: taxfreegold.co.uk
